Wittgenstein Centre Data Explorer
Explore, select and download data of the global population projections by age, sex and education published by Lutz, Butz, and K.C. (2014). Access the executive summary .
This is an older version of the Wittgenstein Centre Human Capital Data Explorer. The newest version of the demographic estimates is available in the latest data explorer .
Basic underlying assumptions used in the projection of future indicators. Available at the country level only. Full information on the scenarios can be found on the About page.
Wittgenstein Centre Graphic Explorer
Explore, visualise and download graphics of the global population projections by age, sex and education published by Lutz, Butz, and K.C. (2014). Access the executive summary .
This is an older version of the Wittgenstein Centre Human Capital Data Explorer. The newest version of the demographic estimates is available in the latest data explorer .
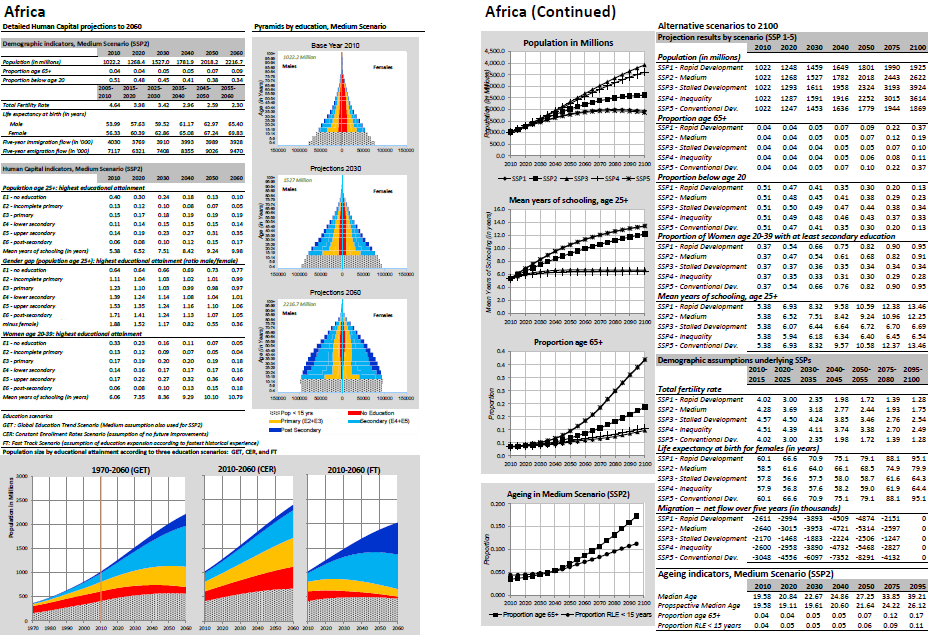
Download profile pages of each continent and 171 countries from the appendix of Lutz, Butz, and K.C. (2014).
Note: The image to the right is a sample preview. It will not update.
Further Details
More detailed information on how to use this web application. Further reading on the data from the global population projections by age, sex and education is provided in Lutz, Butz, and K.C. (2014). Access the executive summary .
Overview
The new set of projections by levels of educational attainment was produced by a large team of researchers at the Wittgenstein Centre for Demography and Global Human Capital and at other institutions. It also includes population projections developed for the 5th assessment report of the Intergovernmental Panel on Climate Change (IPCC) according to a set of Shared Socioeconomic Pathways (SSP) scenarios. There are two main areas where the new projections advance the state of the art beyond other existing global population projections (those that cover most world countries):
- They explicitly and systematically incorporate population heterogeneity by level of education, thereby illustrating how educational attainment can and should be routinely added to age and sex as a third demographic dimension.
- The assumptions about future trends in fertility, mortality, and migration include the scientific input of more than 500 population experts around the world who responded to an online questionnaire and assessed the validity of alternative arguments as well as the conclusions of intensive discussions at five meta-expert meetings.
Version 1.2 includes the back projections from 2010 to 1970. More information in Speringer et al. 2015.
Citation
The suggested citation for data and plots from this website is:
Wittgenstein Centre for Demography and Global Human Capital, (2015). Wittgenstein Centre Data Explorer Version 1.2. Available at: http://www.wittgensteincentre.org/dataexplorer
Credits
Data Explorer Team at the Wittgenstein Centre for Demography and Global Human Capital:
Concept and Coordination:
Data:
- <a href=“http://www.iiasa.ac.at/web/home/research/researchPrograms/WorldPopulation/Staff/K-C-Samir.en.html"target="_blank">Samir K.C.
Web Interface:
Researchers who participated in the development of the projections:
| M. Jalal Abbasi-Shavazi | Anne Goujon* | Fernando Riosmena |
| Guy J. Abel* | Michel Guillot | Louis Rosero-Bixby |
| Alicia Adsera | Graeme Hugo | Arodys Robles |
| Bilal F. Barakat* | Lori Hunter | Richard G. Rogers |
| Stuart Basten | Gavin Jones | Anna Rotkirch |
| Ramon Bauer* | Samir K.C.* | Nikola Sander* |
| Jan Van Bavel | James K.S. | Warren C. Sanderson* |
| Donatien Beguy | Siew-Ean Khoo | Zeba Sathar |
| Caroline Berghammer* | Henri Leridon | Sergei Scherbov* |
| Ayla Bonfiglio | Marc Luy* | Bruno Schoumaker |
| William P. Butz* | Wolfgang Lutz* | David Shapiro |
| Graziella Caselli | Douglas Massey | Vegard Skirbekk* |
| John Casterline | Bruno Masquelier | Tomas Sobotka* |
| Teresa Castro-Martin | John F. May | Erich Striessnig* |
| Minja Kim Choe | Blessing Mberu | Christian Wegner-Siegmundt* |
| Youssef Courbage | France Meslé | Maria Rita Testa* |
| Sven Drefahl | Melinda Mills | Olivier Thévenon |
| Rachel E. Durham* | S. Philip Morgan | Edward Jow-Ching Tu |
| Regina Fuchs* | Elsie Pamuk* | Laura Wong |
| Tomas Frejka | François Pelletier | Brenda Yepez-Martinez |
| Alessandra Garbero | Michaela Potančoková* | Kryštof Zeman* |
| Michel Garenne | Ronald R. Rindfuss | Zhongwei Zhao |
| * From the Wittgenstein Centre for Demography and Global Human Capital | ||
Web interface built using:
- shiny: Chang, W., Cheng J., Allaire, J.J., Xie, Y. & McPherson, J. (2013). shiny: Web Application Framework for R. R package version 0.11.1
Additional R packages used for data manipulations and visualisation:
- dplyr: Wickham, H., & Francois, R. (2015). dplyr: A Grammar of Data Manipulation. R package version 0.4.1
- googleVis: Gesmann, M., & de Castillo, D. (2011). Using the Google visualisation API with R. The R Journal, 3(2), 40-44.
- magrittr: Bache, S.M. & Wickham, H. (2015). magrittr: A Forward-Pipe Operator for R. R package version 1.5
- markdown: Allaire, J.J., Horner, J., Marti, V. & Porte, N. (2015). markdown: Markdown rendering for R. R package version 0.7.4
- reshape2: Wickham, H. (2007). Reshaping Data with the reshape Package. Journal of Statistical Software, 21(12), 1-20.
- saves: Daróczi, G. (2013). saves: Fast load variables. R package version 0.5
Converting HTML plots to PDF and PNG:
English language editior:
IT Server:
General:
Data and Graphic Explorer:
For further details see:
-
Samir, K. C., & Lutz, W. (2014). The human core of the shared socioeconomic pathways: Population scenarios by age, sex and level of education for all countries to 2100. Global Environmental Change.
-
Samir, K. C., Potančoková, M., Bauer, R., Goujon, A. & Striessnig, E. (2013). Summary of Data, Assumptions and Methods for New Wittgenstein Centre for Demography and Global Human Capital (WIC) Population Projections by Age, Sex and Level of Education for 195 Countries to 2100. (Interim Report No. IR-13-018). Laxenburg, Austria: International Institute for Applied Systems Analysis.
For further details see:
- Bauer, R., Potančoková, M., Goujon, A. & Samir, K. C. (2012). Populations for 171 Countries by Age, Sex, and Level of Education around 2010: Harmonized Estimates of the Baseline Data for the Wittgenstein Centre Projections. (Interim Report No. IR-12-016). Laxenburg, Austria: International Institute for Applied Systems Analysis.